
Minecraft Prometheus Exporter
最近久しぶりにMinecraftサーバを立てたのですが、最近はForgeではなくてSpigot系のmodが流行なんですね。
自分はModといえば1.7.10という感じだったので、1.19に入って大分進歩したんだなあと思った次第です。
今回はMinecraftサーバの監視もモダンにするため、Prometheusを活用したいと思います。
定番のGrafanaによる可視化までやっていきます。
今回インストールするのは
/minecraft-prometheus-exporter
です。
Minecraft系のエクスポーターでちゃんとメンテナンスされてそうだったというのが選定理由です。
インストール時に調べながらやっていて手間がかかったので、備忘録がてら書き残しておきます。
プラグインをビルドしてインストール
まず前提として、このプラグインはbukkit/spigot系の環境でしか動きません。
今回の環境は下記のdocker-compose.ymlを利用しています。
TYPE: “SPIGOT”だけでspigot環境が作れるのは便利ですね。
$ cat docker-compose.yml
version: "3"
services:
  mc:
    image: itzg/minecraft-server
    ports:
      - 25565:25565
    environment:
      VERSION: "1.19"
      TYPE: "SPIGOT"
      EULA: "TRUE"
    tty: true
    stdin_open: true
    restart: always
    volumes:
      - ./data:/data
    networks:
      nginx-proxy:
networks:
  nginx-proxy:
    external: true
それではdataディレクトリに移動します。
dataディレクトリの中身はこんな感じです。
data$ ls
banned-ips.json      bundler       help.yml   minecraft_server.1.18.2.jar  permissions.yml  server.properties       usercache.json  world
banned-players.json  commands.yml  libraries  minecraft_server.1.19.jar    plugins          spigot.yml              versions        world_nether
bukkit.yml           eula.txt      logs       ops.json                     server-icon.png  spigot_server-1.19.jar  whitelist.json  world_the_end
pluginsディレクトリに移動します。
ここでプラグインのリポジトリをクローンします。
data/plugins$ git clone https://github.com/sladkoff/minecraft-prometheus-exporter.gitそしてmaven installをします。
mavenが無かったらapt get mavenで入手してください。
minecraft-prometheus-exporter内に移動してビルドを行い、jarファイルを生成します。
plugins$ cd minecraft-prometheus-exporter
data/plugins/minecraft-prometheus-exporter$ mvn install
targetフォルダ内にjarができあがるので、これをpluginsディレクトリに移動します。
data/plugins/minecraft-prometheus-exporter $ mv target/minecraft-prometheus-exporter-2.5.1-SNAPSHOT.jar ../
data/plugins/minecraft-prometheus-exporter $ cd ../
data/plugins$ ls
PluginMetrics  minecraft-prometheus-exporter  minecraft-prometheus-exporter-2.5.1-SNAPSHOT.jar
ここでdocker-compose.ymlのあるディレクトリに戻り、docker-compose upをします。

この表示が出ていれば無事読み込まれています。
いったんCtrl+Cで停止させてみるとplugins内にPrometheusExporterというディレクトリが生成されます。
そこでPrometheusがexporterの情報を読み取れるように、中のconfig.ymlのホスト設定をlocalhostから0.0.0.0に変更します。
$ cat data/plugins/PrometheusExporter/config.yml
host: 0.0.0.0
port: 9940
enable_metrics:
entities_total: true
villagers_total: true
loaded_chunks_total: true
jvm_memory: true
players_online_total: true
players_total: true
tps: true
world_size: true
jvm_threads: true
jvm_gc: true
tick_duration_median: true
tick_duration_average: true
tick_duration_min: false
tick_duration_max: true
player_online: false
player_statistic: false
今度はdocker-compose up -dでデーモン化し、Prometheus上のネットワークからアクセスできることを確認してみます。
~$ docker exec -it minecraft_mc_1 bash
root@f253f20320bb:/# curl http://mc:9940/metrics
# HELP mc_tick_duration_max Max duration of server tick (nanoseconds)
# TYPE mc_tick_duration_max gauge
mc_tick_duration_max 2.4799968E7
# HELP mc_villagers_total Villagers total count, labelled by world, type, profession, and level
# TYPE mc_villagers_total gauge
# HELP mc_tick_duration_average Average duration of server tick (nanoseconds)
# TYPE mc_tick_duration_average gauge
mc_tick_duration_average 8086516.0
# HELP mc_world_size World size in bytes
# TYPE mc_world_size gauge
mc_world_size{world="world",} 1.28338086E8
mc_world_size{world="world_nether",} 3867169.0
~以下省略~
無事メトリクスが取得できていますね!
Prometheus側の設定
今度はPrometheus側の設定を行っていきます。
prometheus.ymlのscrape_configにこの設定を書き加えます。
dockerのコンテナ名のmcに対してデータの取得を行います。
- job_name: 'minecraft'
  static_configs:
    - targets: ['mc:9940']
  labels:
    server_name: 'minecraft_server'
ここに詳細は書いていませんが、Prometheusと同一のネットワーク上に展開されるようにしてください。
Prometheusを再起動してprometheus.ymlを再読み込みさせます。
ダッシュボードのインポート
Grafanaは既にPrometheusと連携できているものとして進めます。
よくわからない人はこちらの記事も併せてごらんください。
まずGrafanaのダッシュボードをインポートする画面に移ります。
そしてImport via panel jsonに公式の作ったダッシュボードのjsonを投入します。
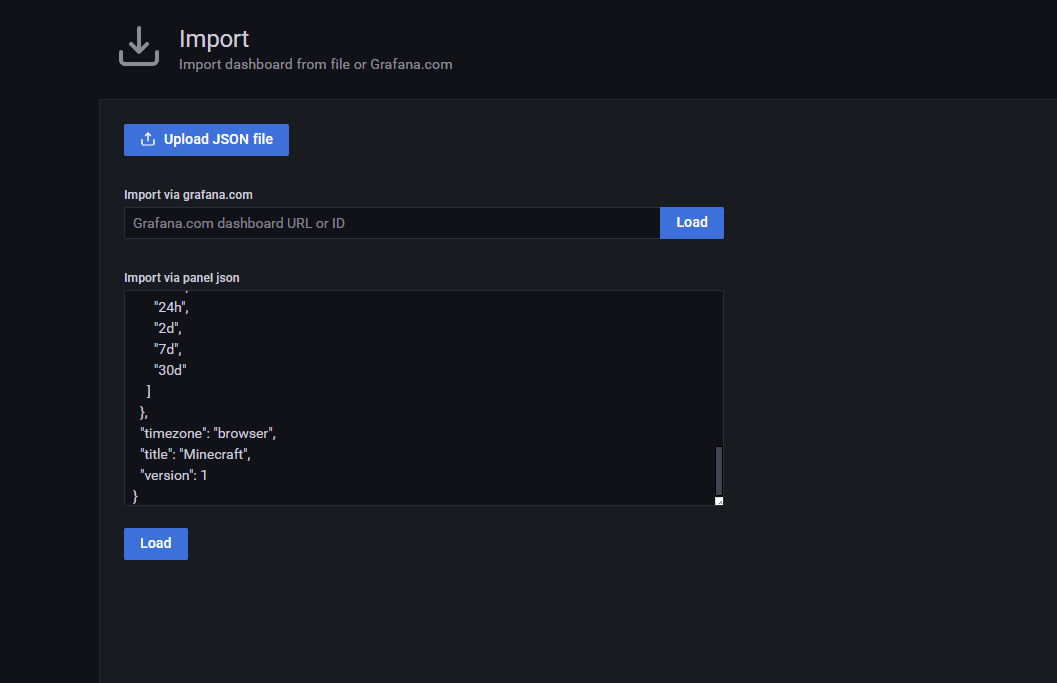
データソースをPrometheusにします。
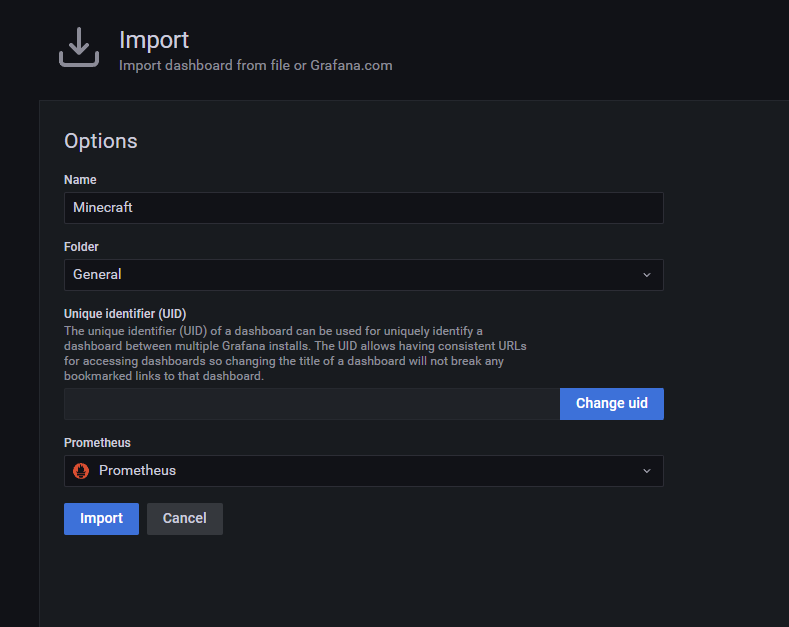
これでOKです!
Players Online=現在のアクティブユーザーが1(自分自身)になっていますね!
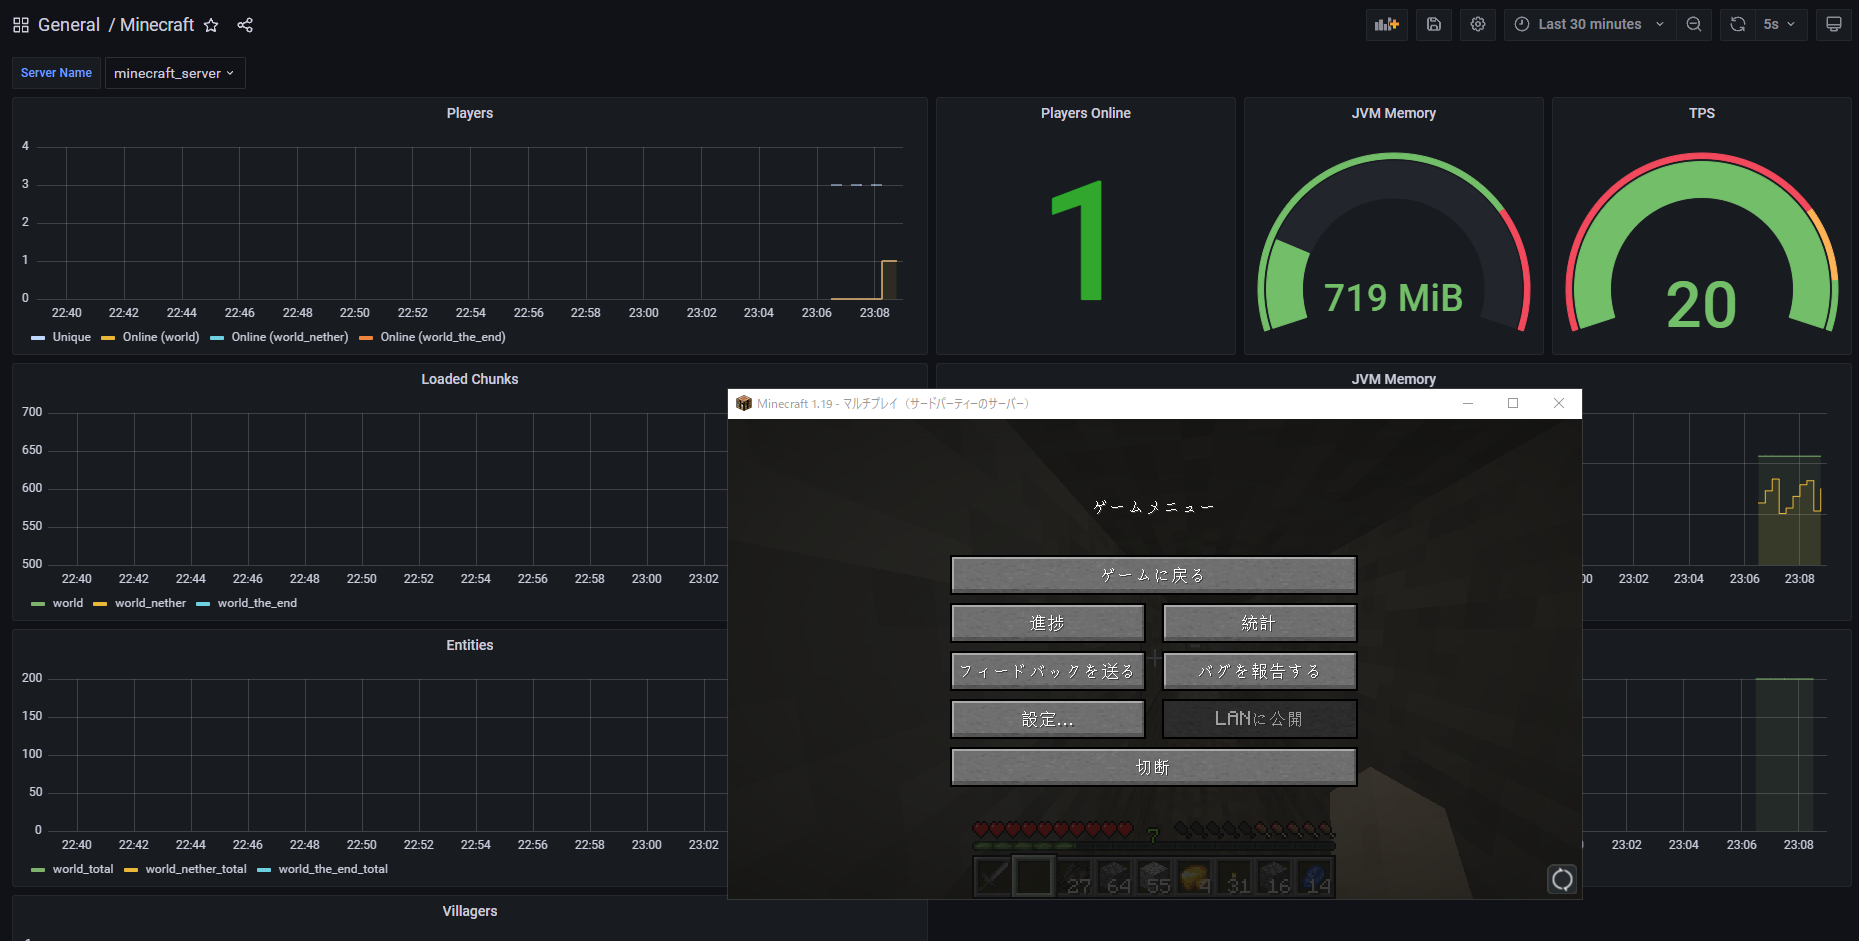
これで監視の設定が完了しました!


コメント